How to Use Lagging Indicators to Evaluate Past Safety Performance and Improve Future
Let’s continue our look at the types of safety data at your fingertips, and how to use them to improve your program. Today we’re looking at lagging indicators. Lagging indicators can help inform what improvements you can make to your future policies.

Lagging indicators: Looking through the rearview mirror
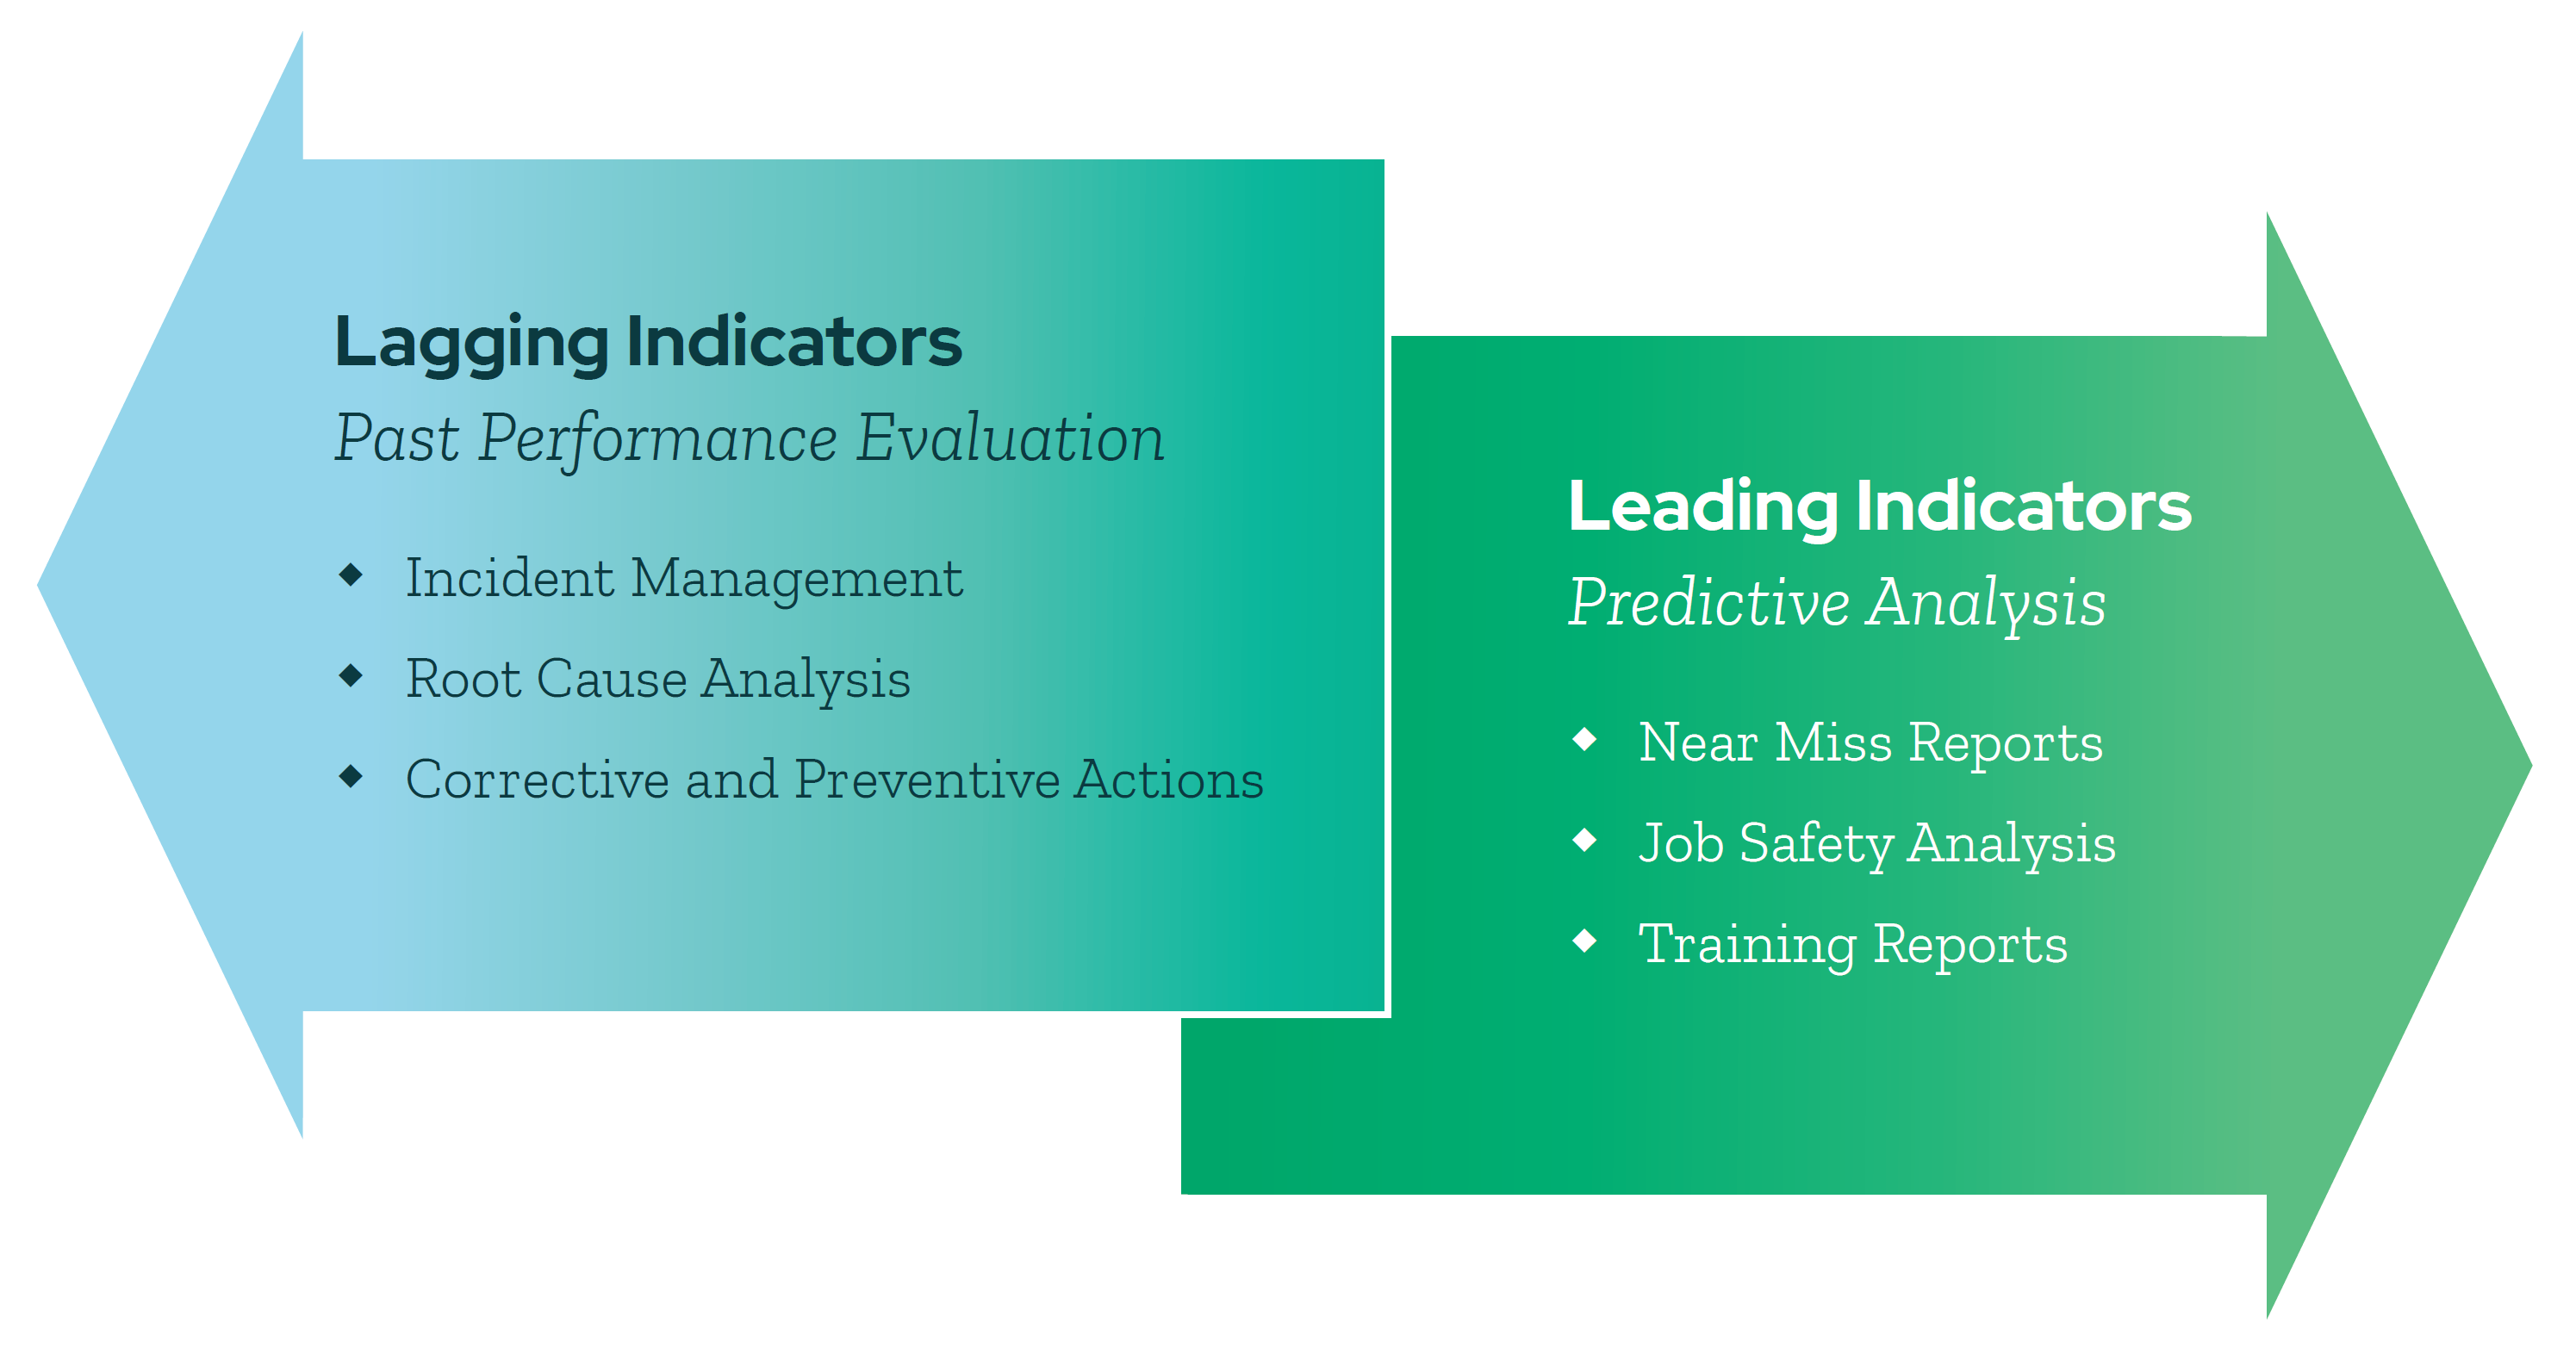
Dive into how to use your data and analytics tools to take account of long-term trends and evaluate the past performance of your safety procedures. Want some examples? Try these:
Incident Management
Reporting can help you analyze your team’s incident management in terms of preparedness, response, and recording. Incident Management analytics give you a firm understanding of your current procedures and how to improve them.
Root Cause Analysis
There’s a lot to be learned from analyzing previous injuries and incidents. Root Cause Analysis will provide a deep dive into the initial cause of accidents to prevent future harm.
Corrective and Preventive Actions
Lagging indicator analysis allows leaders to determine the corrective and preventative actions to improve workplace safety. Use your data insights to identify actionable next steps to resolve safety issues and what retraining can be enforced to prevent future accidents.
Lagging Indicator Example: Regulatory Reporting
Accidents happen. When they do, you need to record information quickly to ensure both swift action and proper reporting to avoid hefty citations and potential legal action.
In the immediate aftermath of a workplace injury, rarely is anyone’s first thought “we need to report this to the Occupational Health and Safety Administration.” Rather, initial considerations have to do with seeking medical attention, followed by rectifying the source of the incident. Then comes an assessment of the financial impact—workers’ compensation, lost productivity, potential legal claims, and so on.
But while OSHA reporting and recordkeeping may not seem as urgent as an unconscious employee or a toppled forklift, the process is a vital part of environmental health and safety management. And for many organizations, an incident that isn’t recorded and reported in a timely manner can bring significant expenses, as the minimum fine for a single late or missing report is $5,000.
OSHA Reporting Forms and Logs
OSHA reporting and workplace safety data go hand-in-hand. OSHA gathers safety data from companies through three main forms: OSHA Form 301, OSHA Form 300, and OSHA 300A.
OSHA Form 301
OSHA’s Form 301 is the basic incident report after a workplace injury or illness. It collects information about the particulars of an event: the time and location of the incident, which employee or employees were involved, what occurred before and after the incident, the physician or health care professional who tended to the employee or employees, and so forth.
OSHA Form 300
The OSHA 300 Form is an annual log of recordable cases. Every incident that requires Form 301 must also be included on that year’s Form 300. For each reportable incident, the form logs the name of the injured employee, the employee’s job title, the date and location of the injury, the kind of injury that occurred, and a brief description of the event. When a compliance officer requests information about workplace safety, they’re usually looking for Form 300—they want to review the number and severity of incidents over the past year. The shorter your Form 300, the better.
OSHA 300A
OSHA 300A summarizes all cases recorded on Form 300 for a given year. Total work-related injuries and illnesses are tallied and categorized according to severity: deaths, cases with days away from work, cases with job transfers/restrictions, and other recordable cases. The form also shows the total number of missed workdays and job transfers/restrictions, as well as the total number of incident types (injuries, skin disorders, respiratory problems, poisonings, hearing losses, and all other illnesses). Employee names are left out.
OSHA loves acronyms and abbreviations.
We’ve got two more to add to your bowl of alphabet soup: TRIR and DART are essential acronyms that you should understand when it comes to your company’s safety record.
TRIR
TRIR is the acronym for Total Recordable Incident Rate and is the number of recordable incidents per 100 employees. This number allows you to evaluate your injury rates against industry averages. Companies and customers often turn to this data point as a critical safety performance indicator.
DART
DART stands for Days Away from work, days of Restricted work activity, and days of jobs Transfer. This OSHA-mandated safety metric helps employers determine how many workplace injuries and illnesses caused employees’ work to be missed, restricted, or transferred to another job within a calendar year.
OSHA monitors these results.
They’re a factor in determining whether you get selected for a visit from your friendly OSHA inspector. Look for EHS software that will automate your report generation and submission. Finally, don’t think of these as solely regulatory requirements. Use this lagging indicator data to improve your safety program.
KPA EHS Helps Businesses Take a Data-Driven Approach to Safety
KPA EHS simplifies data visualization and reporting, giving users easy access to actionable insights into their EHS program performance. Your data is presented in real-time, so no delay or extra steps are required to access the information. The dashboards are configured based on features tailored to your business’s unique requirements, giving you the power to make informed decisions that impact workplace safety.
Let KPA show you how to take a data-driven approach to safety.

